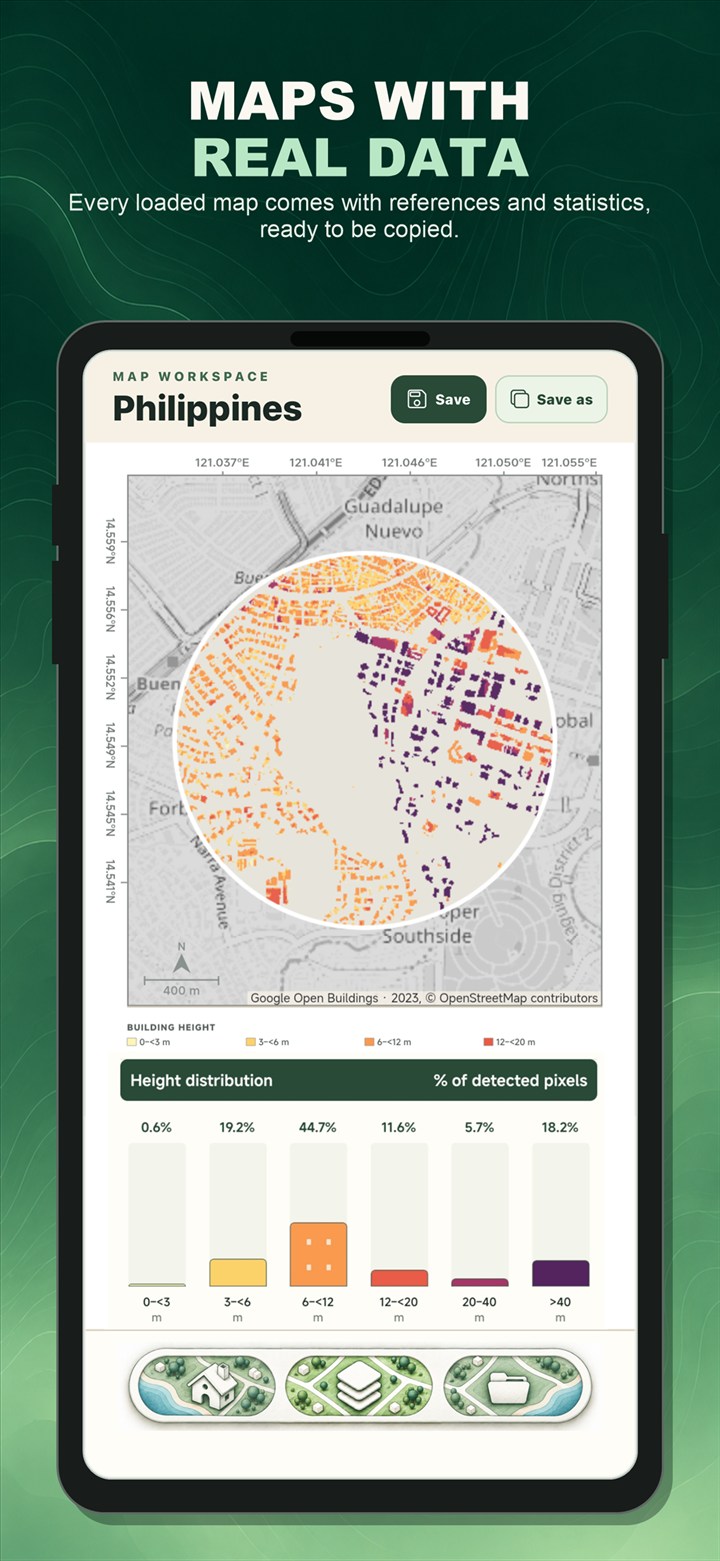
Maps appear in theses, dissertations, field reports, environmental studies, planning presentations, and classroom projects because location matters. A good map tells the reader where the study happened, how the study area was defined, and what geographic patterns are relevant to the question.
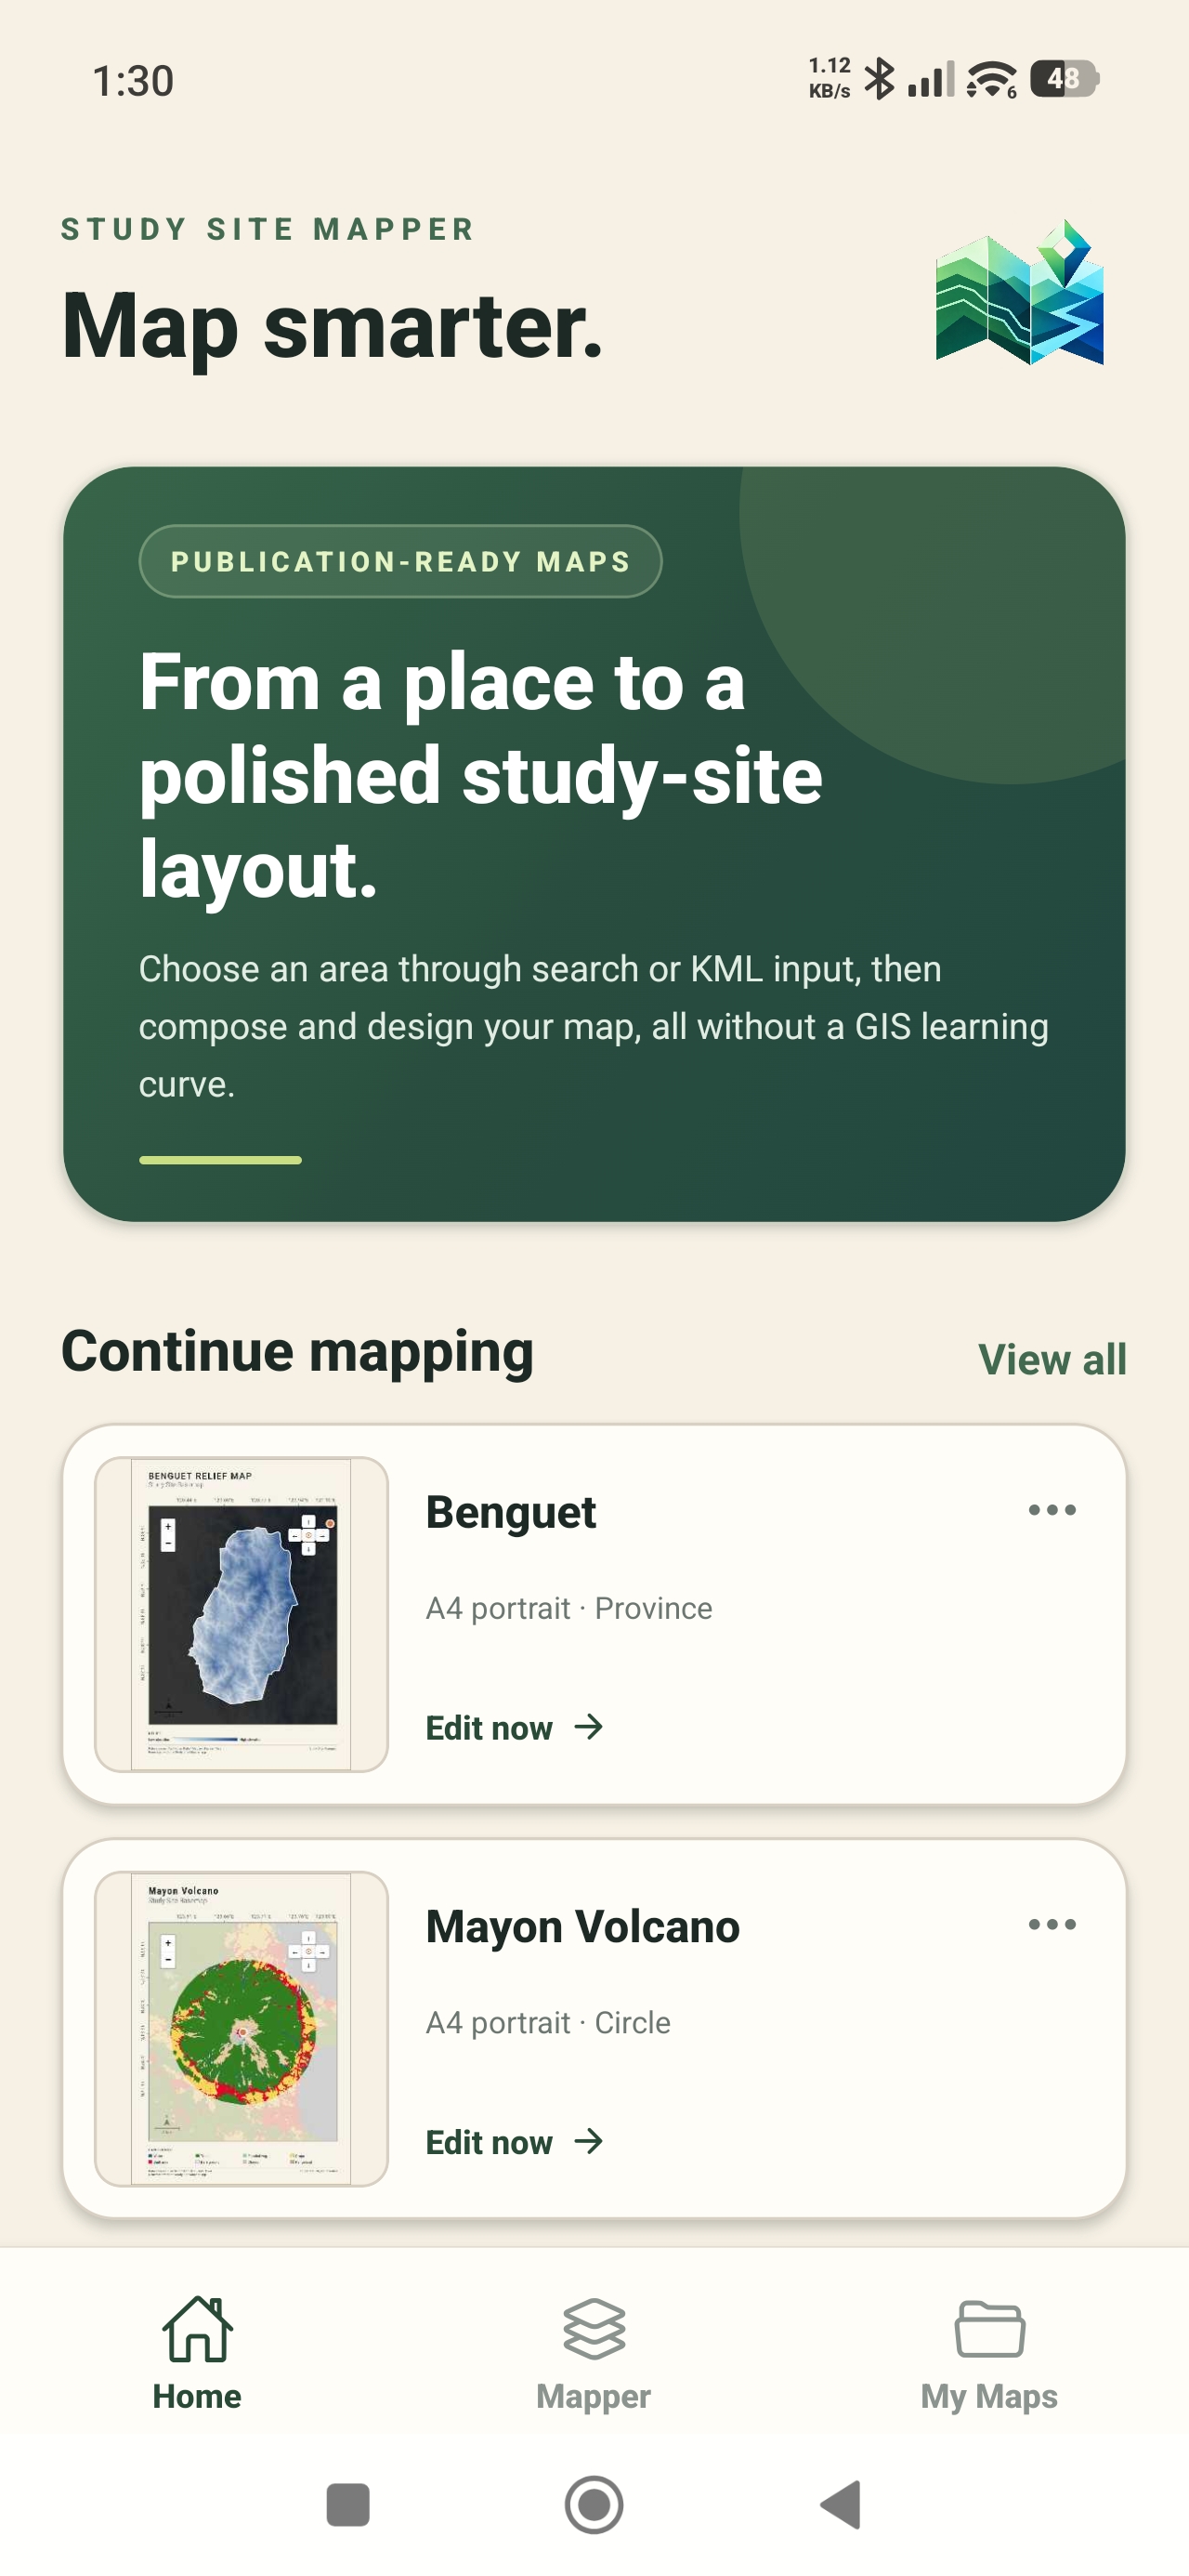
For many students and researchers, the difficult part is not understanding why a map is needed. It is finding easy-to-use mapping software that can turn a location into a clear, presentable figure without a long setup process. Study Site Mapper is designed for that practical middle ground: a guided mobile map maker with ready-to-load layers, study-area statistics, and PNG or PDF export.
Study Site Mapper is available on the App Store and Google Play. You can begin mapping without creating an app account.
What students and researchers need from mapping software
The right tool depends on the project. Full desktop GIS remains important for advanced geoprocessing, specialized analysis, and authoritative production workflows. But many academic tasks begin with a more focused need:
- show the location and boundary of a study site;
- add a basemap and essential map elements;
- visualize an environmental, landscape, or socioeconomic layer;
- review statistics calculated for the selected area; and
- export a clear figure for a paper, report, poster, or presentation.
Study Site Mapper brings these steps into one mobile workflow. It is especially useful when you need to draft or review a map away from a computer, prepare a site overview before fieldwork, or create a polished figure without building the entire layout from scratch.
Start with the exact area behind your research question
A study area can be a point and its surrounding radius, a square site, an administrative boundary, or a custom polygon. In Study Site Mapper, you can search for a place, enter coordinates, choose an available administrative area, use your current location, draw a circle or square, or import a KML boundary.
This first decision shapes everything that follows. A thesis about an urban neighborhood, a coastal habitat, and a country-level population pattern should not use the same map extent. Select the smallest boundary that still answers your question clearly. Smaller, focused sites can also make high-resolution layers easier to load and interpret.
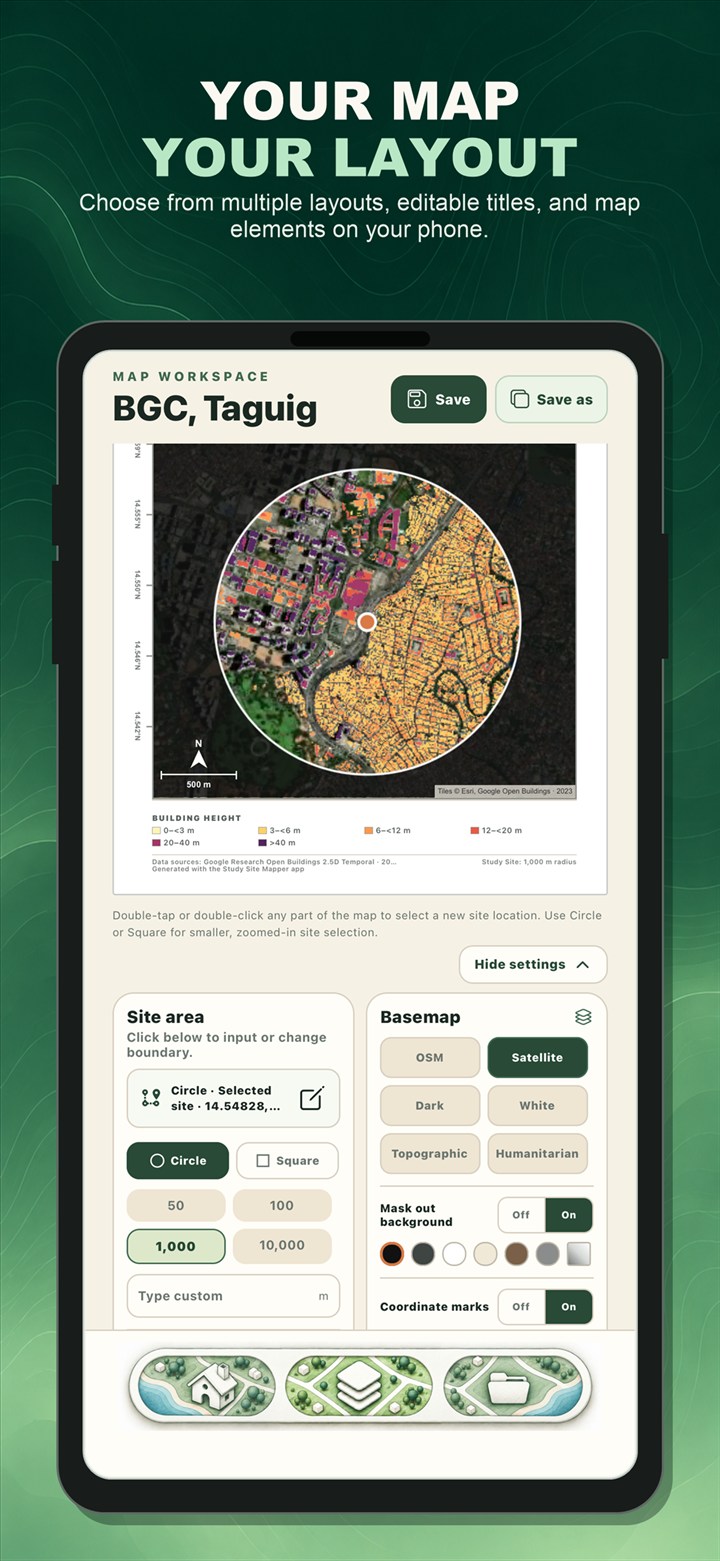
Build a readable map layout
The Mapper workspace combines the map and its presentation controls. Choose a basemap, edit the title, set the paper orientation and color, adjust the study-area outline, and add elements such as a scale bar, north arrow, coordinate marks, or a location inset when they help the reader.
The goal is not to place every possible element on one page. A useful academic map has a visual hierarchy: the study area is obvious, the thematic layer is readable, and supporting elements explain the map without competing with it.
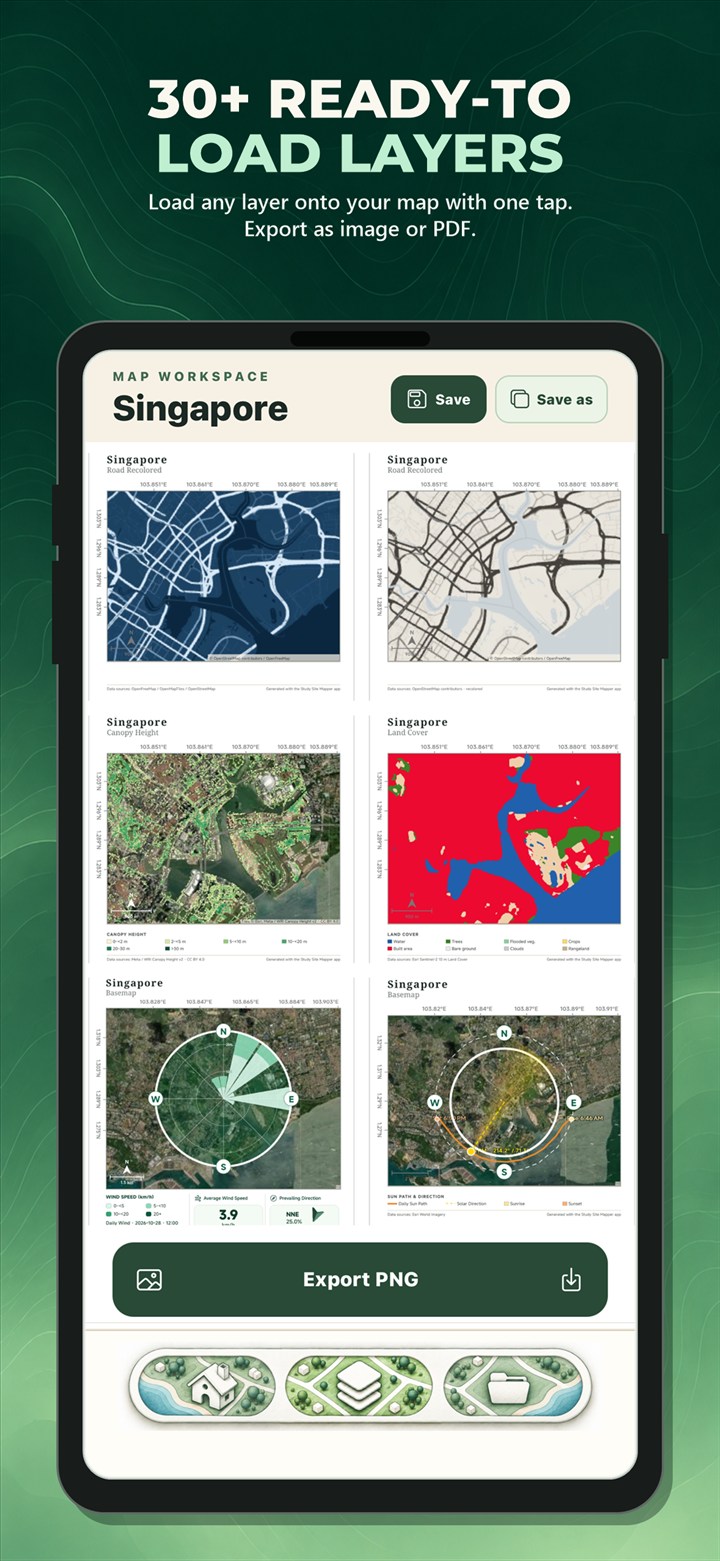
Explore ready-to-load geographic layers
Study Site Mapper includes more than 30 environmental, landscape, and socioeconomic layer options. Depending on the location and source coverage, these can help you examine terrain elevation, slope, land cover, canopy or building height, population, river networks, solar resource, mangroves, seagrass, aboveground biomass, building use, and other mapped characteristics.
Choose a layer because it supports the research question, not simply because it looks interesting. Elevation and slope may be relevant to terrain or hazard context. Land cover can describe the dominant surface classes within a site. Population and building-use layers can add human context. Each dataset has its own date, resolution, coverage, and limitations, so the source information remains part of responsible interpretation.
Connect the map with study-area statistics
A colored map shows spatial pattern, while statistics help describe what is inside the selected boundary. The Loaded Data view presents the available summaries, charts, source notes, and interpretation guidance for the active layer. The exact metrics vary because elevation, land cover, population, and mapped habitat extent represent different types of data.
These results can help with preliminary exploration and clear communication. They should not be treated as a replacement for source-dataset validation, field measurements, or the analytical methods required by your discipline. For critical findings, record the source, date, spatial resolution, limitations, and the boundary used for the calculation.
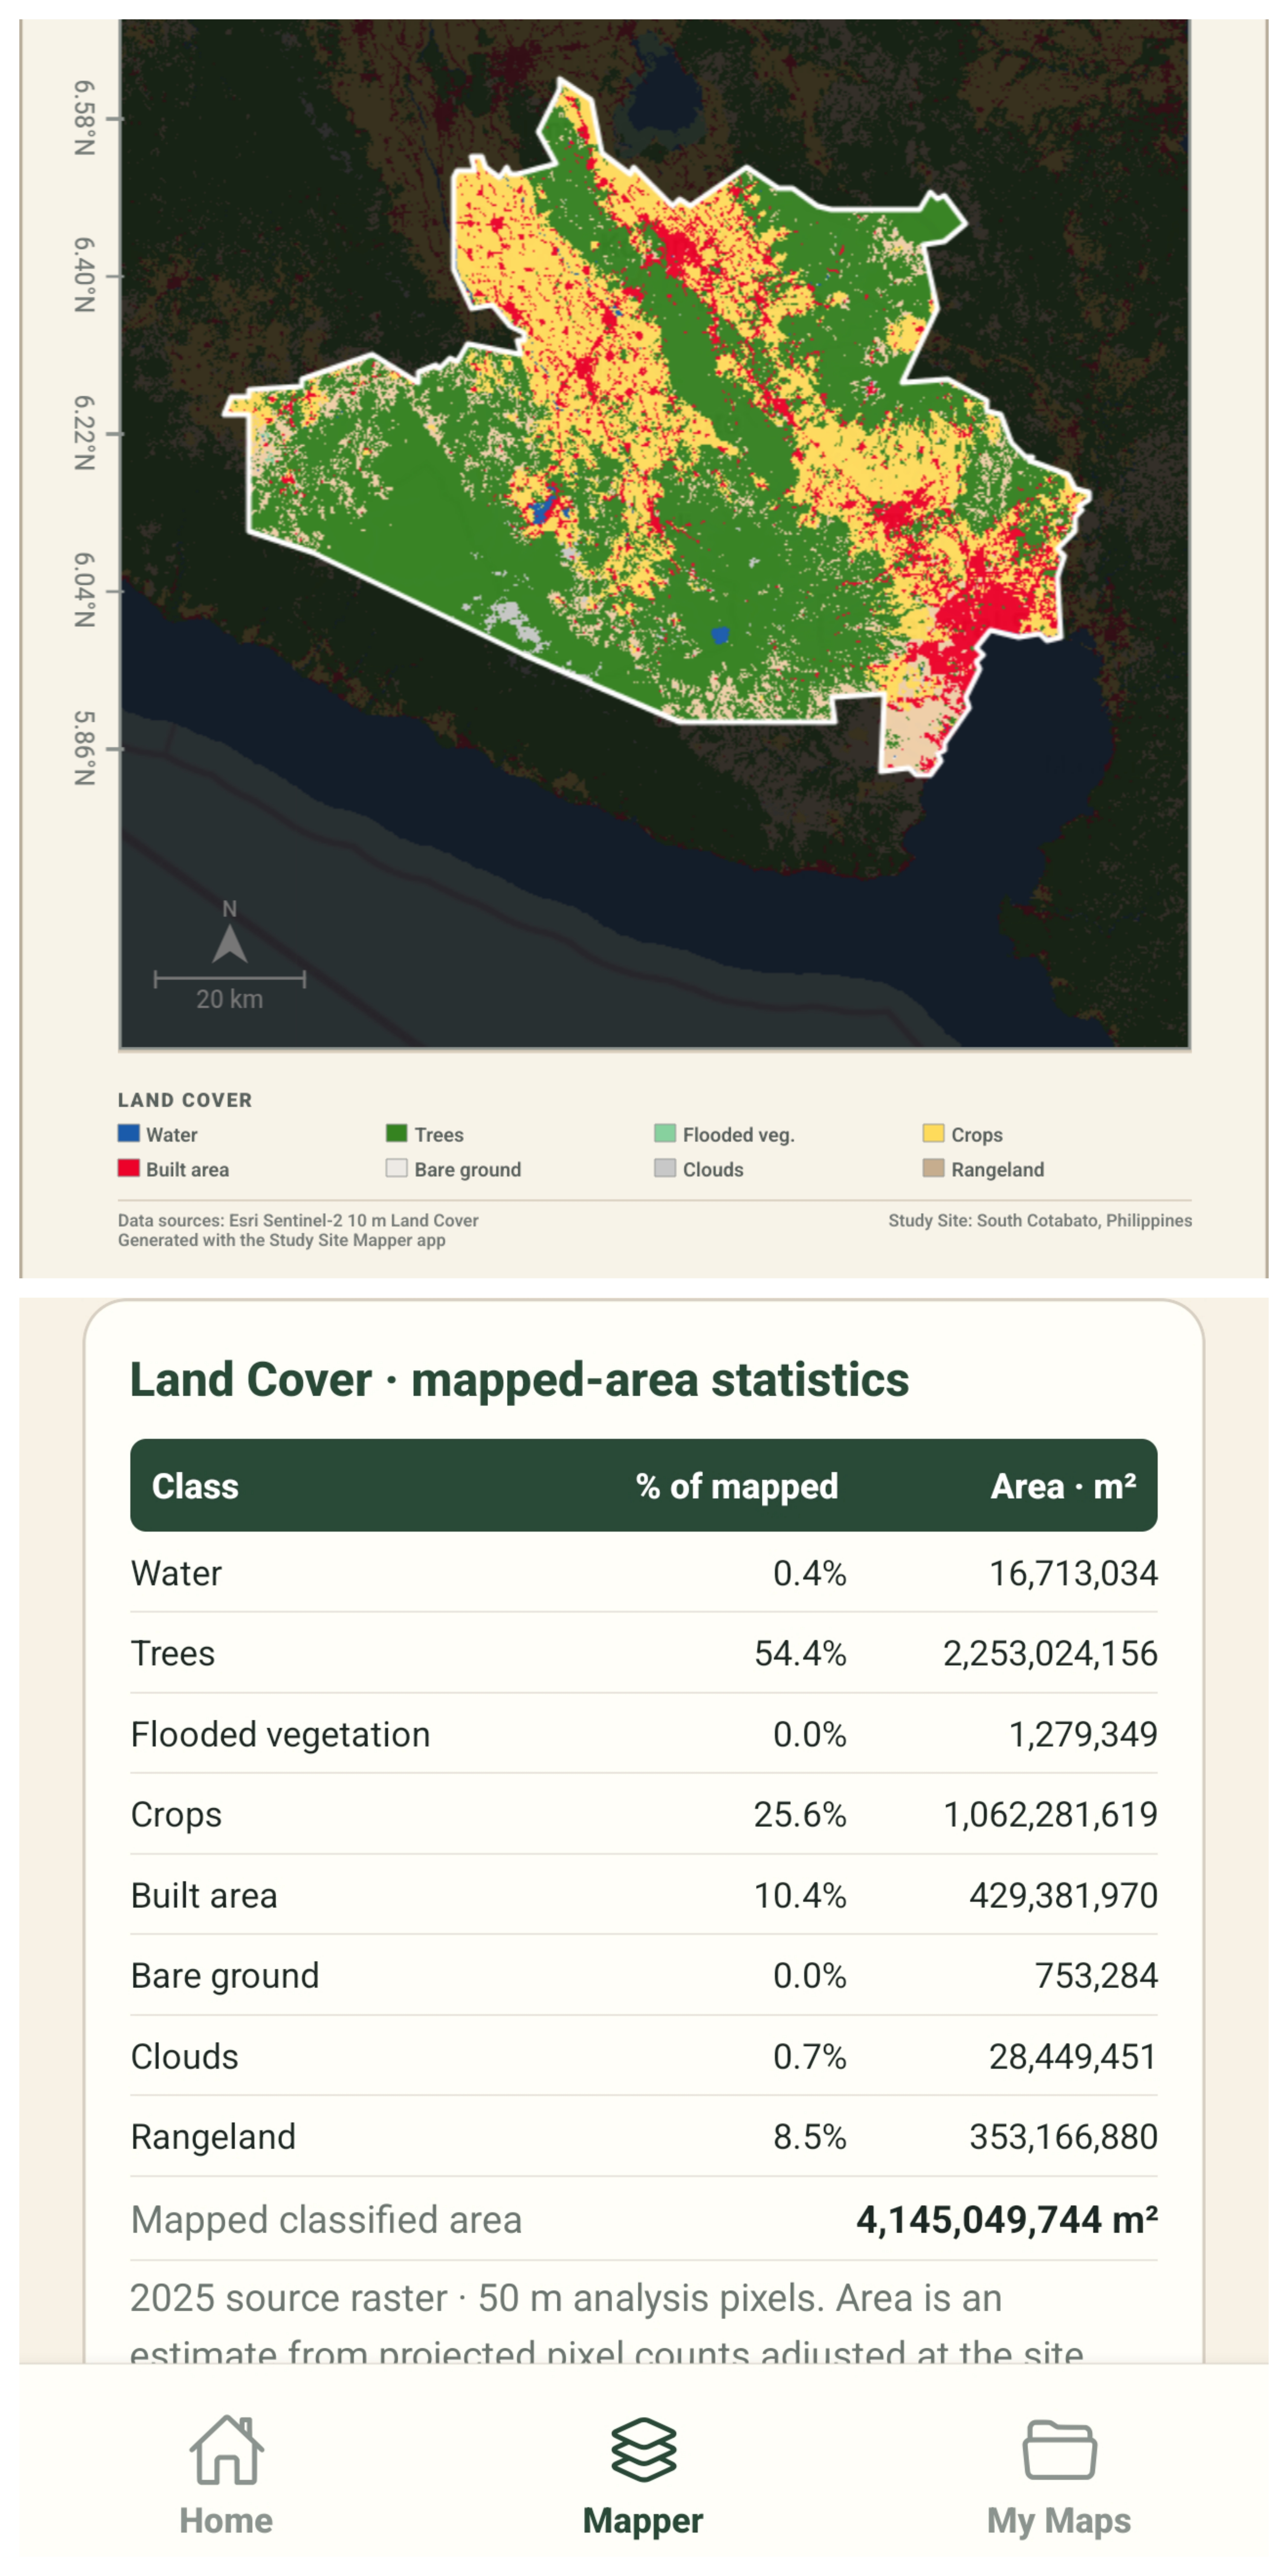
Export figures for a thesis, report, poster, or class presentation
When the layout is ready, export the map as a PNG for documents and slides or as a PDF for reports and printing. Projects can also be saved locally so you can reopen a map, refine the layout, or compare another layer later.
Before submitting academic work, check that the title is specific, the legend matches the displayed layer, labels are readable at the final document size, source credits remain visible, and the map supports the argument made in the surrounding text.
Examples of student and research use
Thesis and dissertation figures
Create a location map for the methodology or study-area section, then add a thematic layer that directly relates to the research question.
Environmental and field studies
Review terrain, land cover, water, vegetation, or settlement context before a site visit and use the exported map as a planning or communication aid.
Architecture, planning, and site analysis
Present the broader location of a project and explore available physical or socioeconomic context for an initial site assessment.
Classroom projects and presentations
Help students connect a geographic question with a defined area, a relevant dataset, and a map they can explain to classmates.
Frequently asked questions
What mapping software can students use for a thesis or research project?
Study Site Mapper is a mobile option when the task involves defining a study area, creating a map layout, loading available geographic layers, reviewing mapped-area statistics, and exporting a PNG or PDF figure. Projects requiring advanced geoprocessing or authoritative analysis may still need desktop GIS and specialist review.
Do I need GIS experience to use Study Site Mapper?
No prior GIS experience is required for the guided map-building workflow. You should still understand the meaning and limitations of the dataset you choose, especially when the map supports a research conclusion.
Can I create a study area map on my phone?
Yes. You can select a site, customize the map, explore available layers and statistics, and export the finished figure from a supported phone. For a step-by-step walkthrough, read How to Create a Study Area Map on Your Phone.
Study Site Mapper is an educational, research, and general-purpose site-analysis tool. It is not intended for cadastral or professional land surveying, engineering certification, legal boundary determination, emergency response, or authoritative navigation. Dataset coverage, dates, resolution, and accuracy vary by source.

Turn your study site into a clear map.
Define an area, explore ready-to-load layers, review available statistics, and export your map using your phone.