A study area map answers the first geographic question behind a project: where does this research or site analysis take place? It helps readers locate the site, understand its scale, and connect the study boundary with the surrounding environment or community.
Traditional map-making workflows can involve separate tools for boundaries, basemaps, layouts, insets, statistics, and export. Study Site Mapper brings these steps together on a phone. You can begin a map in seconds, refine the layout at your own pace, and export a finished figure for a thesis, research paper, report, poster, or presentation.
Download Study Site Mapper from the Apple App Store or Google Play and start building study area maps directly from your phone.
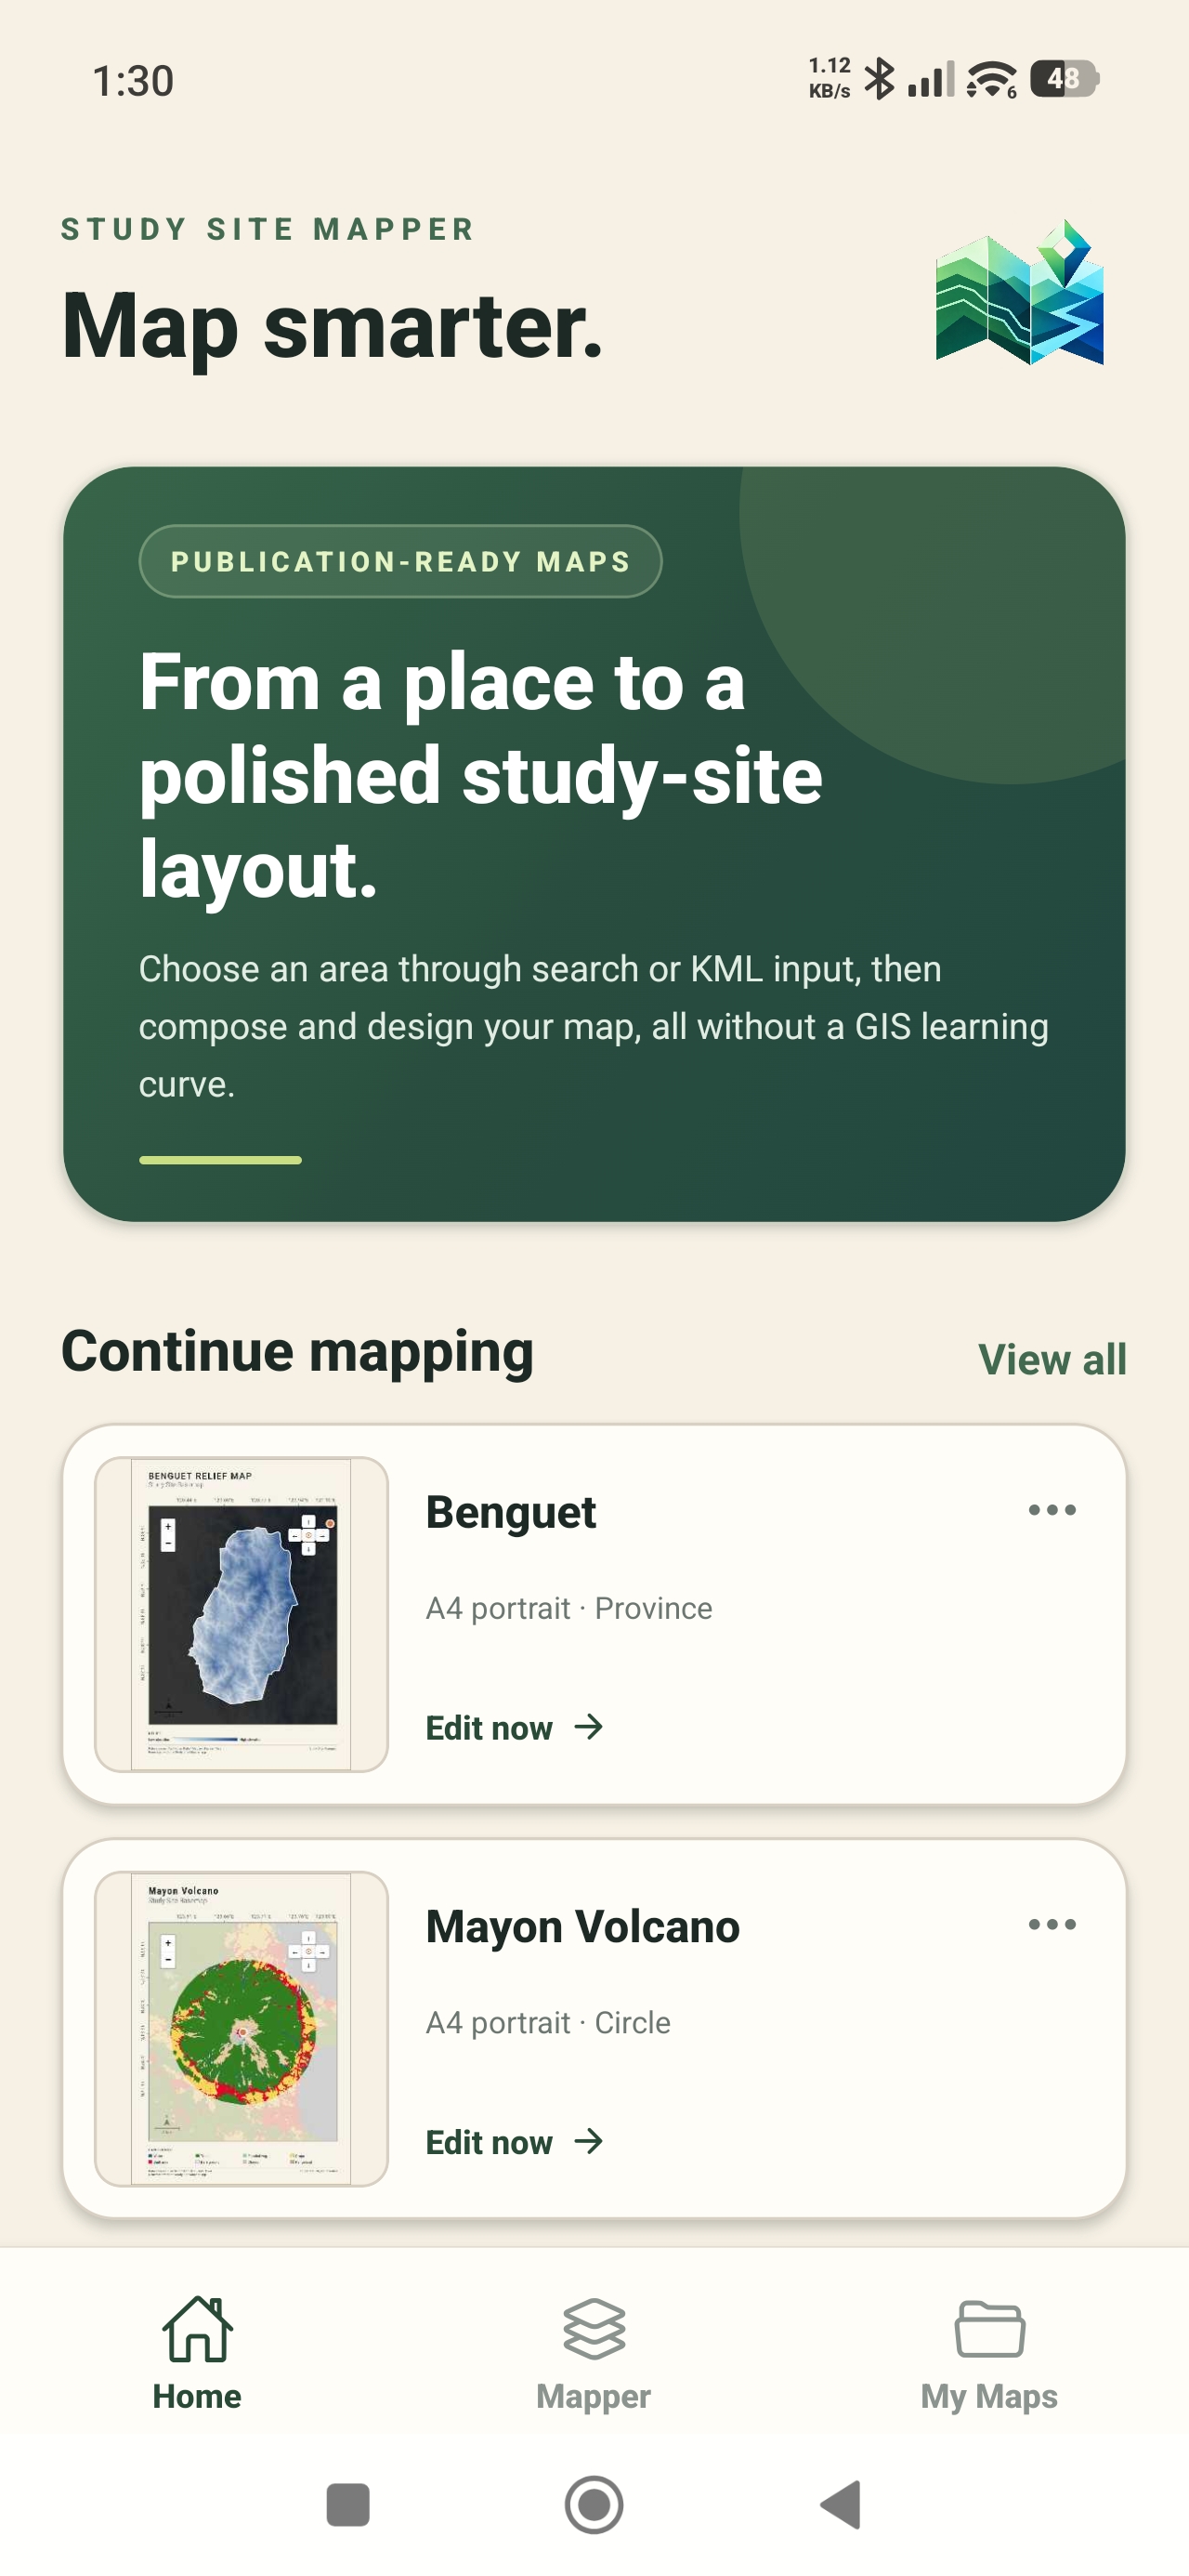
Step 1: Choose your study area
Start by defining the exact place behind your question. Study Site Mapper gives you several ways to begin:
- search for a place;
- enter latitude and longitude coordinates;
- choose an available administrative boundary;
- use your current location;
- create a circle or square around a site; or
- import a custom KML boundary.
Select the smallest area that still supports your purpose. A focused boundary usually creates a clearer map and makes detailed geographic layers easier to interpret.
Step 2: Create the map layout
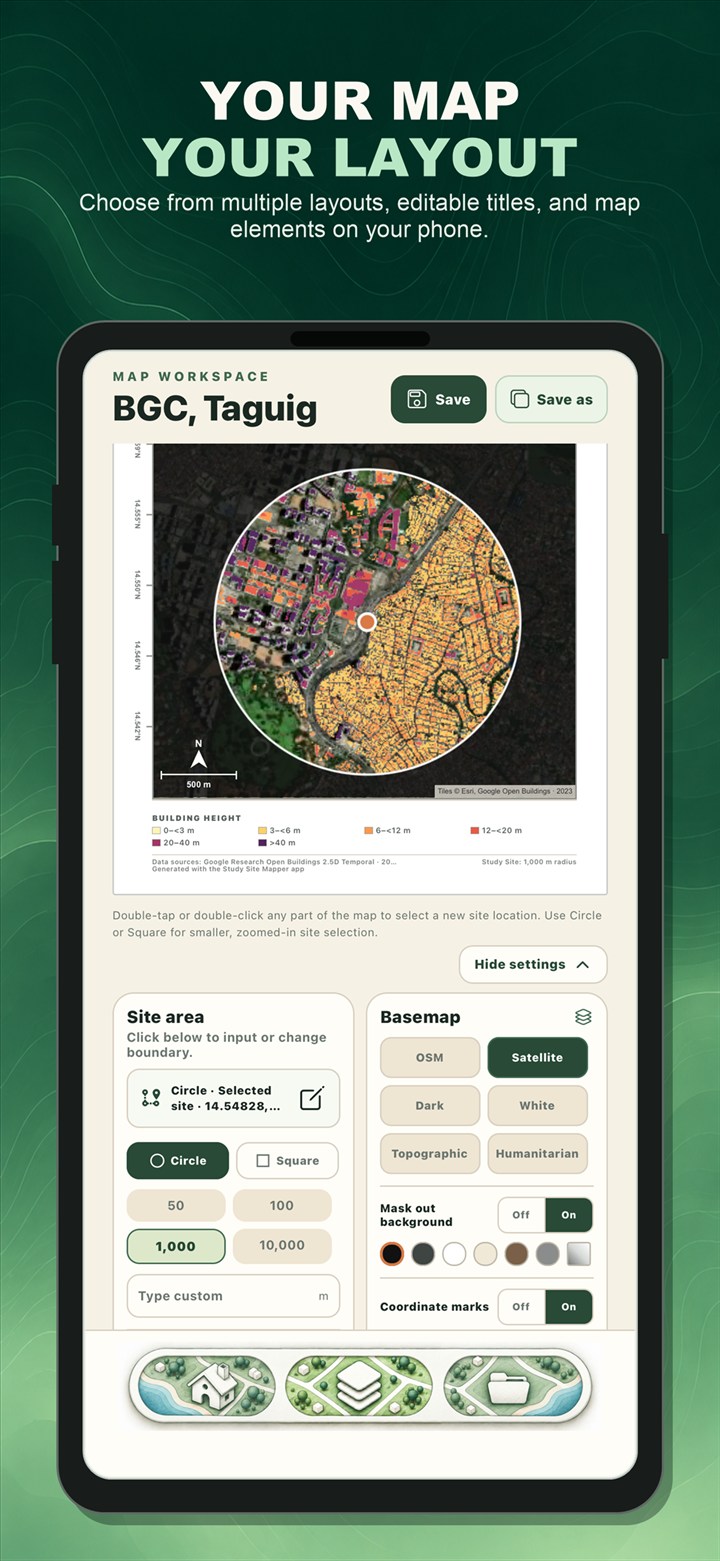
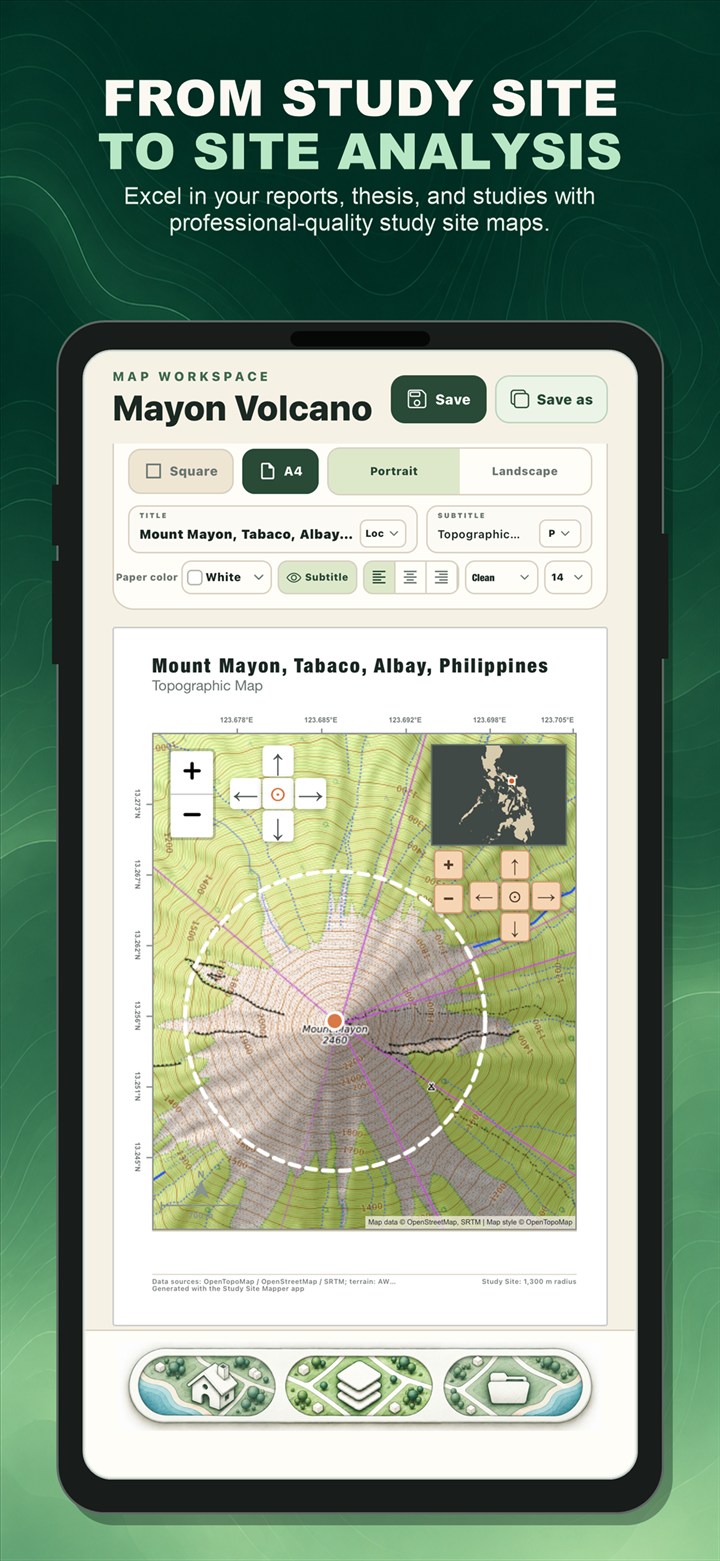
Open the Mapper workspace and choose the basemap and page format. Add a specific title, adjust the study-area outline, and decide which supporting map elements help the reader. Depending on the map, these may include a north arrow, scale bar, coordinate marks, legend, or location inset.
The live preview lets you see the map as you make changes. This reduces the back-and-forth between editing and export and helps you check whether labels, colors, and boundaries remain readable.
Step 3: Add geographic context
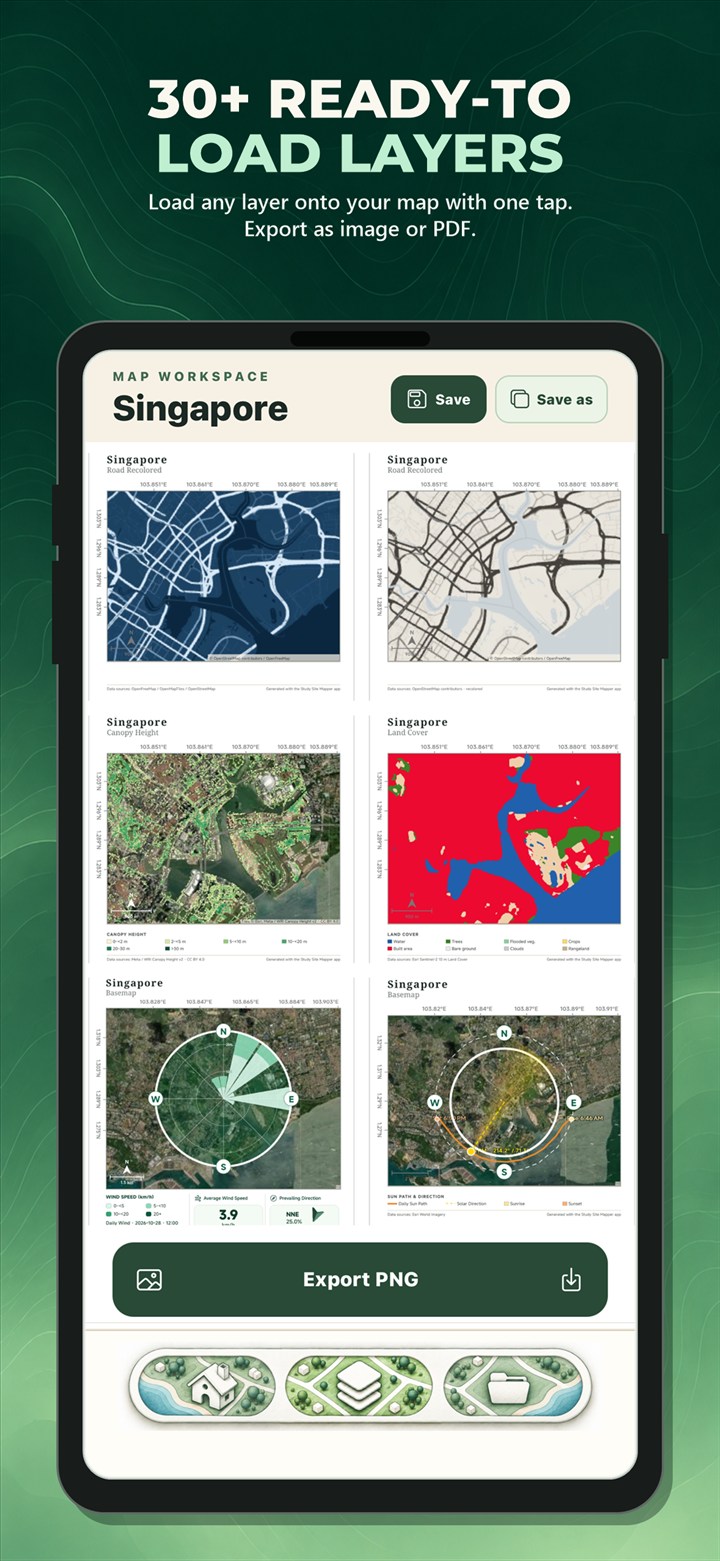
A plain basemap may be enough for a simple location figure. For a thematic or site-analysis map, choose from the available environmental, landscape, and socioeconomic layers. Options include terrain elevation, slope, land cover, canopy and building height, population, river networks, solar resource, mangroves, seagrass, aboveground biomass, building use, and other mapped characteristics.
Choose only a layer that supports the research question. Every source has its own coverage, date, spatial resolution, and limitations, so always review the data-source notes before using the map in an academic conclusion.
Step 4: Review the map and available data
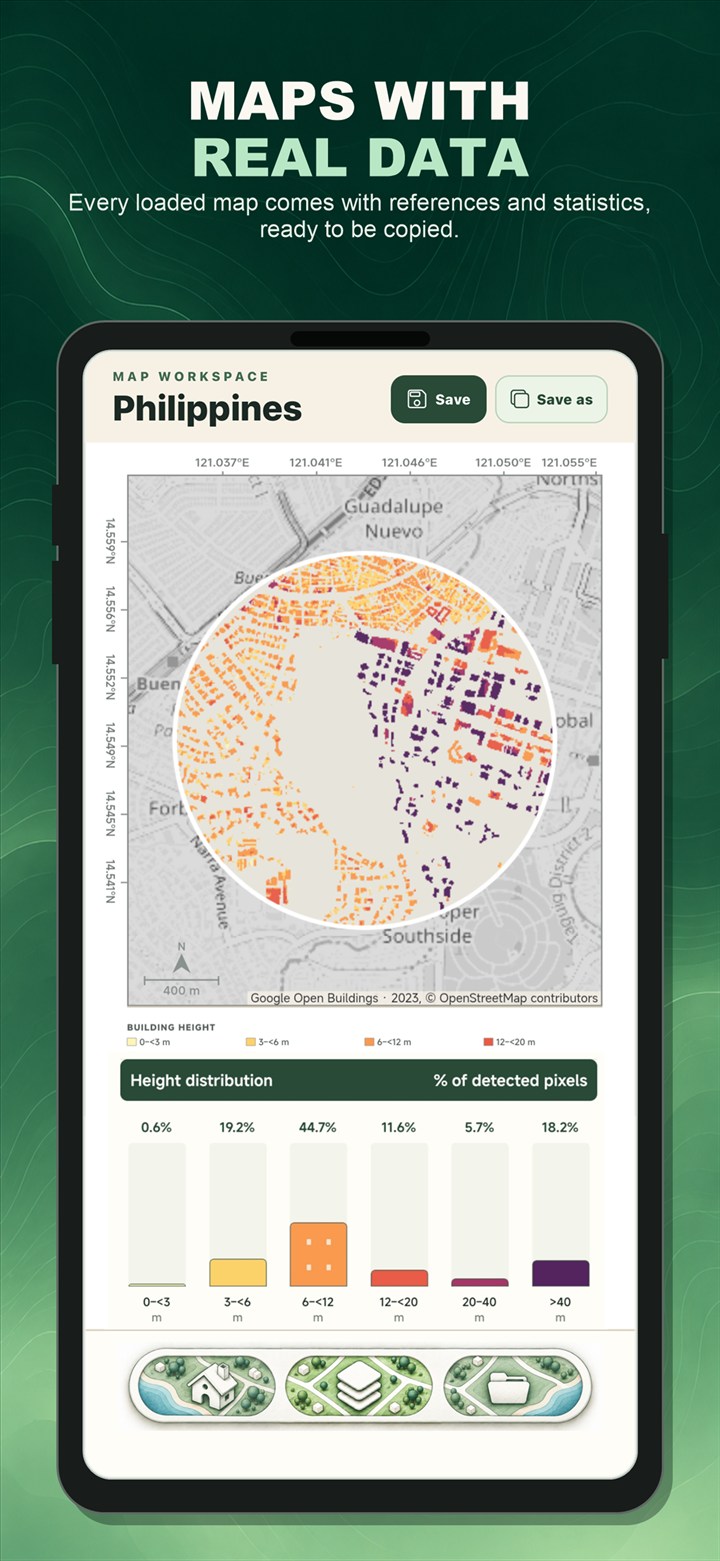
The Main Map shows the spatial pattern inside your site. Loaded Data presents the available summaries, charts, source information, and interpretation notes for the selected layer. The available statistics vary because elevation, land cover, population, and habitat extent describe different kinds of geographic information.
Use these results for exploration and communication, then verify critical findings against the original dataset and the analytical requirements of your field.
Step 5: Export your study area map
Once the figure is ready, export it as a PNG for documents, slides, and posters or as a PDF for reports and printing. You can also save the project locally and reopen it later if you need to revise the title, map style, boundary, or selected layer.
Before submitting your work, confirm that the title identifies the site, the legend matches the active layer, the scale and orientation elements are appropriate, labels are readable at the final size, and source credits remain visible.
See the mobile workflow in action
Watch the official 1 minute 37 second Study Site Mapper video to see location maps, thematic maps, and study area maps created on a phone.
Watch on YouTubeWhat makes a good study area map?
A strong study area map is more than a screenshot. It should make the location understandable to someone who has never visited the site. In many academic and professional contexts, that means combining the detailed site map with broader geographic context.
- Clear boundary: show exactly what area the study covers.
- Descriptive title: identify the site and purpose without making the reader guess.
- Location inset: show where a small site sits within a province, region, or country when needed.
- Scale and orientation: use a suitable scale bar, north arrow, or coordinate marks when they improve interpretation.
- Readable legend: explain the colors and classes of any thematic layer.
- Source information: retain the relevant data credits and review the original dataset limitations.
Frequently asked questions
How can I make a study area map quickly?
Choose your site in Study Site Mapper, select a basemap, customize the map elements, and export the result. Place search, coordinates, administrative boundaries, circles, squares, current location, and KML import provide different ways to start.
What is the difference between a study area map and a location map?
A location map emphasizes where the site is in a wider geographic area. A study area map usually adds more detail about the selected boundary and may include a thematic layer, legend, scale, north arrow, or inset. The terms can overlap, especially when one figure combines both purposes.
Can I make a study area map on an iPhone?
Yes. Study Site Mapper is available on the App Store for iPhone and on Google Play for Android. The app supports study-area selection, map layout, geographic layers, available mapped-area information, project saving, and PNG or PDF export.
Study Site Mapper is an educational, research, and general-purpose site-analysis tool. It is not intended for cadastral or professional land surveying, engineering certification, legal boundary determination, emergency response, or authoritative navigation. Dataset coverage, dates, resolution, and accuracy vary by source.

Make your study area map.
Choose a site, add geographic context, and export a clear map directly from your iPhone or Android phone.